

Flour Definitions and Tests
Defining flour is more complex than a bag of refined all-purpose flour would make it seem. To simplify, we can acknowledge several of the foremost features that differentiate one flour from another: is it milled from the whole grain, or is it sifted to remove a percentage of the germ and bran? Is it fresh, meaning, how recently was it milled? Flour milled from the whole grain and used while fresh is an active ingredient that varies considerably in its physical properties and behavior from aged flour. Understanding these attributes in the flour you use is key to producing consistent quality baked goods. Several tests have been developed to build the baker’s toolbox for measuring flour properties. In this section, we introduce the primary methods used among millers, researchers, industry, and professional bakers.
ALVEOGRAPH: ELASTICITY, EXTENSIBILITY
The purpose of the alveograph method is to quantify the elasticity of air bubbles produced during the fermentation and baking processes of wheat flour. This testing tool measures inflation pressure as a function of time; this means that measurements of dough bubbles as they are inflated are recorded until the moment of rupture. The measurement yields a set of five parameters: maximum overpressure (P), average abscissa (geometric equation) to rupture (L), swelling index (G), configuration ratio (P/L) and deformation energy (W), and elasticity index (EI). Some parameters are more commonly known in reference to their function. P is often used to understand dough resistance to deformation, L is used as an indicator of extensibility or how much a particular dough can stretch before it breaks, and the EI, or elasticity, depends on the type of flour product and must fall within a certain range to achieve desirable bread properties. Recent findings show interconnectedness among the six Alveograph parameters, and bread qualities should be assessed in the context of potential overlap.
ASH CONTENT IN FLOUR
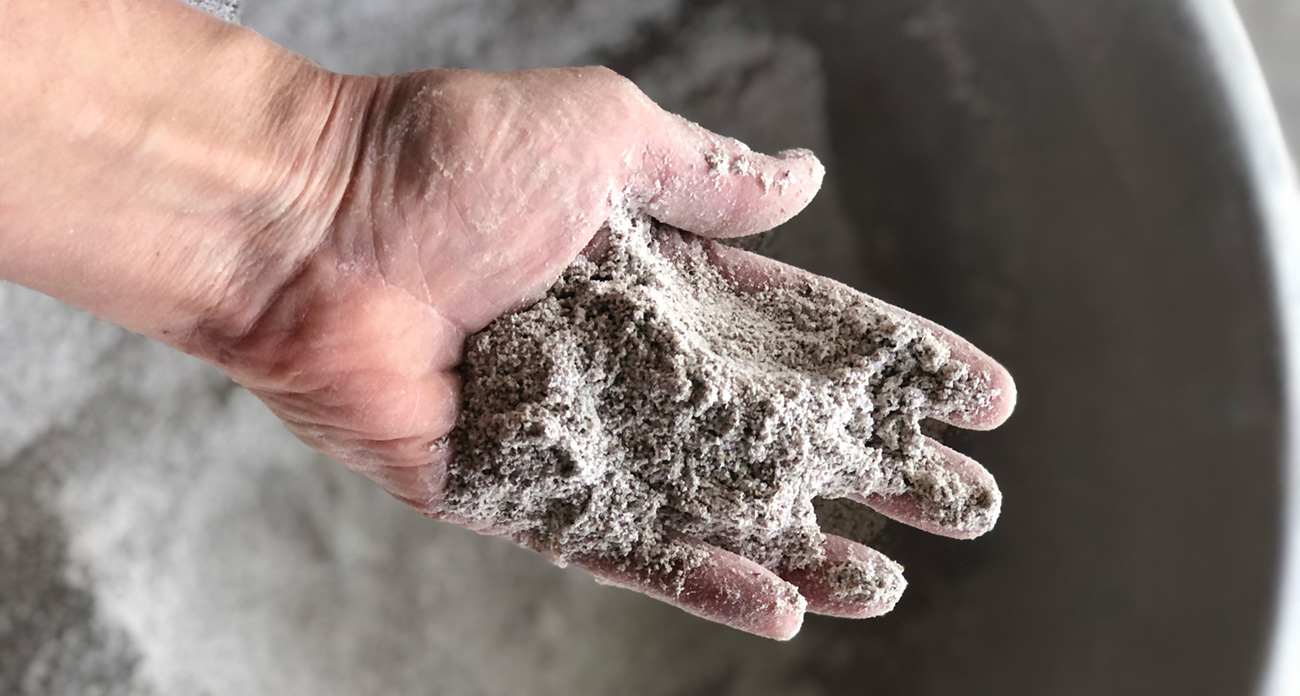
Ash is the mineral content present in flour, measured by the amount of material left after a set quantity of flour is incinerated. The amount of ash in flour largely depends on the wheat variety and milling technique used to produce the flour, but generally, greater amounts of ash content indicate greater amounts of non-endosperm material. Whole grain flours, therefore, have a higher ash content while refined flours have a lower ash content. Ash content is also used as a measure of contamination by non-endosperm material in white or refined flours. The method for measuring ash content involves incinerating a sample weight of flour in a controlled environment and calculating the resulting ash content as a percentage of the original flour sample weight.
FALLING NUMBER TEST
Falling number is one of several measurements for pre-harvest sprouting, which can be detrimental to grain quality. First developed in 1960 and approved as an international standard method in 1982, falling number(FN) is a reliable industry tool used to quantify the effect of enzyme activity on wheat quality of meal or flour through measurement of hydrolyzed starch. Several factors can affect FN measurements including temperature, nitrogen fertilization rate, pesticide use, and altitude. FN is an indirect measurement that associates a faster falling time with a lower FN and high enzyme activity. Similarly, a slower falling time equates to a higher FN and lower enzyme activity. Greater levels of enzyme activity indicate greater damage from sprouting. The FN test has practical implications for the texture and quality of flour products including bread and pasta. Pasta made with low FN flour is typically mushy and delicate, while bread made with low FN flour tends to be dark in color, with a coarse crumb and rubbery texture.
FARINOGRAPH
The Farinograph test is one of the most widely accepted flour quality tests. The Farinograph is a recording dough mixer that measures the torque development as the mixer blades work the dough. This test establishes the relative strength or weakness of a particular flour which helps determine how well the dough can withstand industrial equipment. In addition, the Farinograph establishes parameters such as water absorption, relative mixing time, resistance to overmixing, and peak time. It can also be used to predict the textural characteristics of a finished flour product.
WET GLUTEN TEST
The quality of wheat flour largely depends on the quantity of gluten proteins present. Comprising roughly 80% of total protein content, gluten proteins are dynamic structures that vary between flours milled from different wheat varieties. Gluten content contributes to dough strength and elasticity and is the reason why flour labeling sometimes includes the quantity of gluten present in the flour.
MIXOGRAPH
A mixograph test provides a rapid analysis of dough gluten strength, which includes measuring the resistance of dough to mixing. The results of a mixograph test are an asset to wheat breeders who use the test to screen early generation wheat varieties for dough gluten strength. In addition to assessing gluten properties, the mixograph reports mixing tolerance, peak time, and water absorption. Generally, flour with low gluten development tends to have less mixing tolerance and shorter peak time.
BREAD EVALUATION: VOLUME, CRUMB, TEXTURE
Several properties are important to the palatability and mouthfeel of the final baked loaf, including volume, crumb, and texture. These factors are best assessed qualitatively along with other factors like crust color, symmetry, and aroma. Bread crumb refers to the internal structure of a loaf of bread and can be assessed by looking at the porosity of the finished loaf. Volume refers to the physical size of the loaf as compared to the original weight of the dough.